The Tiny team is proud to introduce Highcharts as one of our Technical Partner Program launch partners. We've been huge fans of the Highcharts team for a long time. Not only do they make a great charting solution, they're great people too. So let's get to spicing up your TinyMCE-generated content with beautiful and interactive charts. Here is what they have to say about why Highcharts Cloud can make your life easier.
The Highcharts dev team's mantra has always been to "make developers' lives easier." That is why we decided to decouple the WYSIWYG charts editor from our hosted service, Highcharts Cloud, thereby allowing developers to add chart-creation capabilities to their own content management systems with just a few lines of code.
Our first integration proof of concept was not hard to decide: TinyMCE. We have been fans of this nifty tool for a long time. Not only is TinyMCE widely used, it is also built to be easy to integrate with. Yes, we're not the only ones who make developers' lives easier.
If you are interested in adding chart creation and publishing capabilities to your TinyMCE powered app, check out this quick guide below. (And please check back on our site in mid-October 2018, when we'll release an update to the chart editor GUI. The integration will remain as simple as it is today.)
The Highcharts editor
The Highcharts Editor is a WYSIWYG editor for creating charts. It’s built on top of the popular Highcharts.JS framework, and lets you quickly design and embed anything from stock charts to polar charts, from line charts to pies.
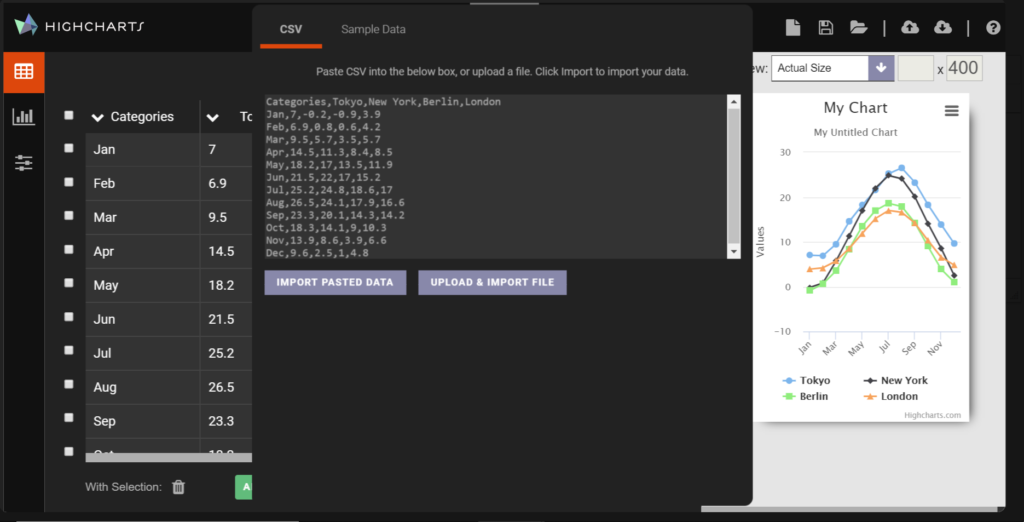
Importing data can be done through CSV or Google Spreadsheets out-of-the-box, but the editor can also be easily extended to import data from pretty much any format and system.
A brief tour
The plugin uses an "a to b" approach, which takes you through the chart creation. It's highly intuitive, while offering enough flexibility and power to easily customize most aspects of the chart.
Importing data
The data importer is a classic spreadsheet-like grid where data can be entered freely. Importing your own data into the editor is as easy as copy/pasting into any cell in the data grid, dragging a CSV onto the grid, or hitting the "Import" button.

Templates
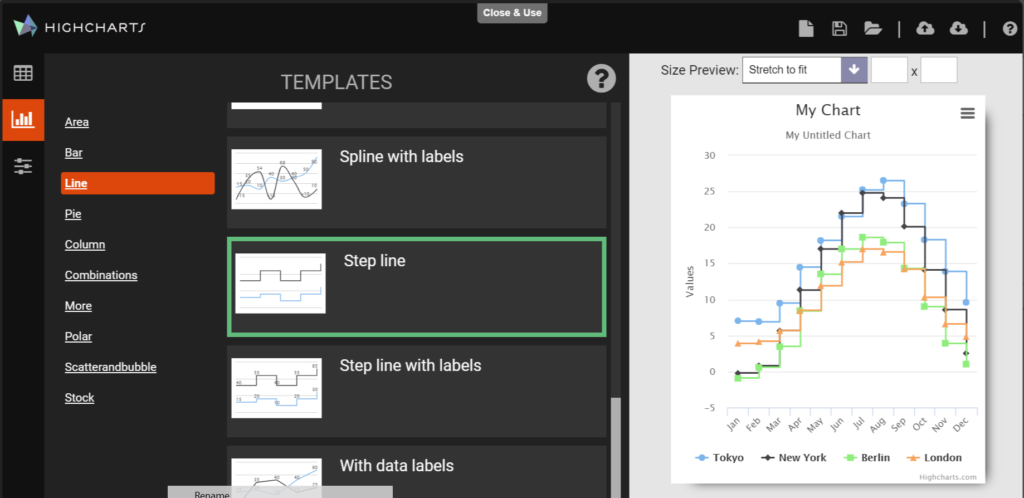
Once your data is uploaded into the editor, the fun begins. The next step is to choose a template for your chart. The built-in templates offer a starting point for the most common chart types, as well as for more esoteric ones. Choosing a template gives you a live preview, and you can always go back and change your template selection at a later time.

Customization options
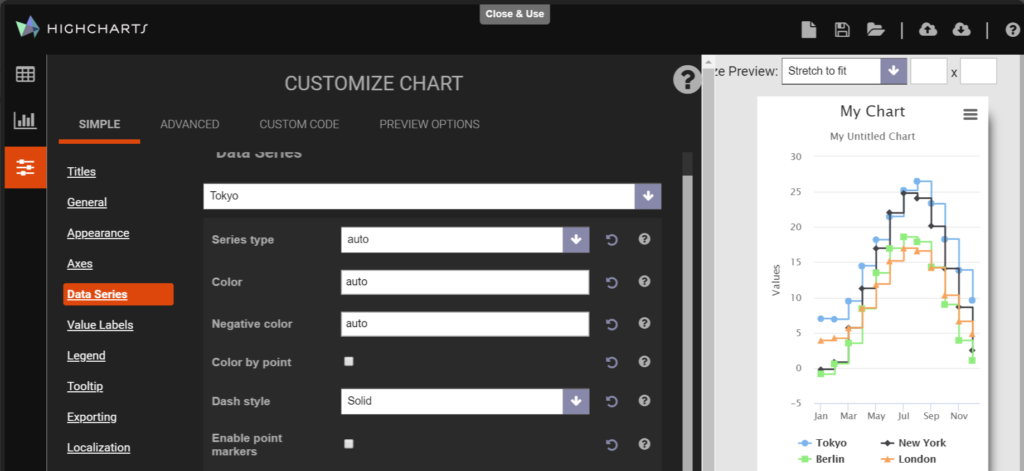
Sometimes, a template just isn’t going to cut it—and that's where customization comes in. Here you can customize most aspects of the chart in a simple-to-navigate interface. You can change everything from the appearance to data label formats, titles, legends, and series types, until you’re satisfied with the result. If you want more advanced control, you can always include the optional advanced mode, which exposes every option available in the Highcharts.JS library.
And if the advanced mode isn’t enough, you can even write your own custom code directly in the plugin.

Embed
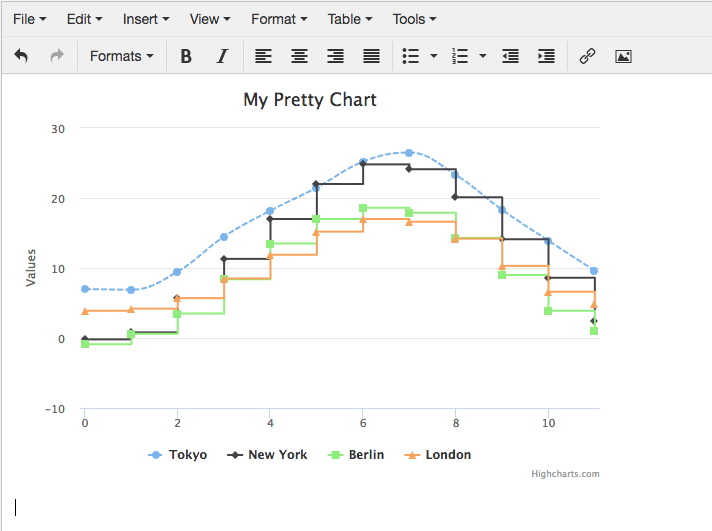
After you have added any required customization, then it’s on to the finishing touch – embedding the chart into TinyMCE. Click the "Close & Use" button on the top of the editor modal, and your chart will appear in the editor.

Installation
Installation of the Highcharts editor plugin requires that two files are included in your page - one file contains the editor sources, and the other file contains the TinyMCE plugin.
The sources can be found prebuilt here. You’re going to need two archive files - highcharts-editor.dist.min.x.y.z.zip and highcharts-editor.tinymce.x.y.z.zip, where x.y.z is the version number. The former contains the minified JavaScript and CSS files for the editor, whereas the latter contains the TinyMCE plugin.
After including the scripts in your application, you need to initialize TinyMCE with the Highcharts plugin. Simply add highcharts and/or highchartssvg (if you only want static charts) to the plugins array in your tinymce.init object. Be sure to also add the insertfile option to the toolbar option. You should also include the noneditable plugin to make the charts more manageable within TinyMCE. You will now find the Highcharts editor when going to the Insert-menu.
Note that charts will remain static within the TinyMCE editor regardless of which option is used to insert it, but fret not. The charts will be real-time (provided that you inserted a real-time chart) both in the preview, and when the content is displayed outside of TinyMCE.
If you're feeling adventurous, you can also clone the highcharts-editor Git repository and build it yourself with gulp. Instructions can be found here. The benefits of doing this is that you’ll be able to build from master. This does come at a cost, as the master branch may not always be stable. On the plus side, it usually has queued up fixes that have not yet made their way into releases.
About Highsoft
Highsoft is the company behind developer-favorite Highcharts JS, and its sister products Highstock JS, Highmaps JS, and Highcharts Cloud.
The company is headquartered in Vik i Sogn, Norway, and has 30 employees working full-time on developing, marketing, and supporting their products. Clients include over 80 of the 100 largest companies in the world. Learn more at highcharts.com.
